Mastering Cost Risk with the CRED Model: A New Approach to Managing Uncertainty

New: SEERai by Galorath
With SEERai, teams move from raw data to estimates in hours instead of weeks. Every output is traceable, audit-ready, and designed to improve decisions across estimating, sourcing, and risk.
Introducing SEER by Galorath
SEER Overview →Galorath’s platform combines trusted cost logic with AI to deliver fast, structured estimates that drive better decisions from design through delivery.
AI use cases
See AI Use Cases →Essential use cases
See All Use Cases →Trusted by leaders in the industry:
Canadian cost estimation teams are leading in confidence and accuracy, but delivery timelines remain a challenge. According to Galorath’s 2025 Industry Report on Cost, Schedule, and Risk, 25% of Canadian respondents report high confidence in their estimation process, and only 17% report frequent cost overruns. These are among the strongest results globally. However, 42% say they frequently miss delivery timelines, a rate exceeded only in Europe.
The issue is not lack of system maturity. Canadian teams report the highest rates of full system integration among all regions surveyed. This connectivity supports strong data usage and coordination, but it has not yet translated into improved schedule performance. Closing this gap will require targeted action. Linking estimation systems with project controls, automating variance alerts, and embedding scheduling risk into early planning are clear next steps.
The survey gathered perspectives from 180 senior and mid-level professionals across industries where cost, schedule, and risk estimation are mission critical. Participants were recruited through a custom process and verified through multi-layer identity authentication to ensure subject matter expertise. Each respondent completed the survey via a unique, single-use link with strict quality controls, fraud detection, and response validation protocols. This approach provides a reliable, third-party–verified view of how organizations are approaching project planning in today’s volatile environment.

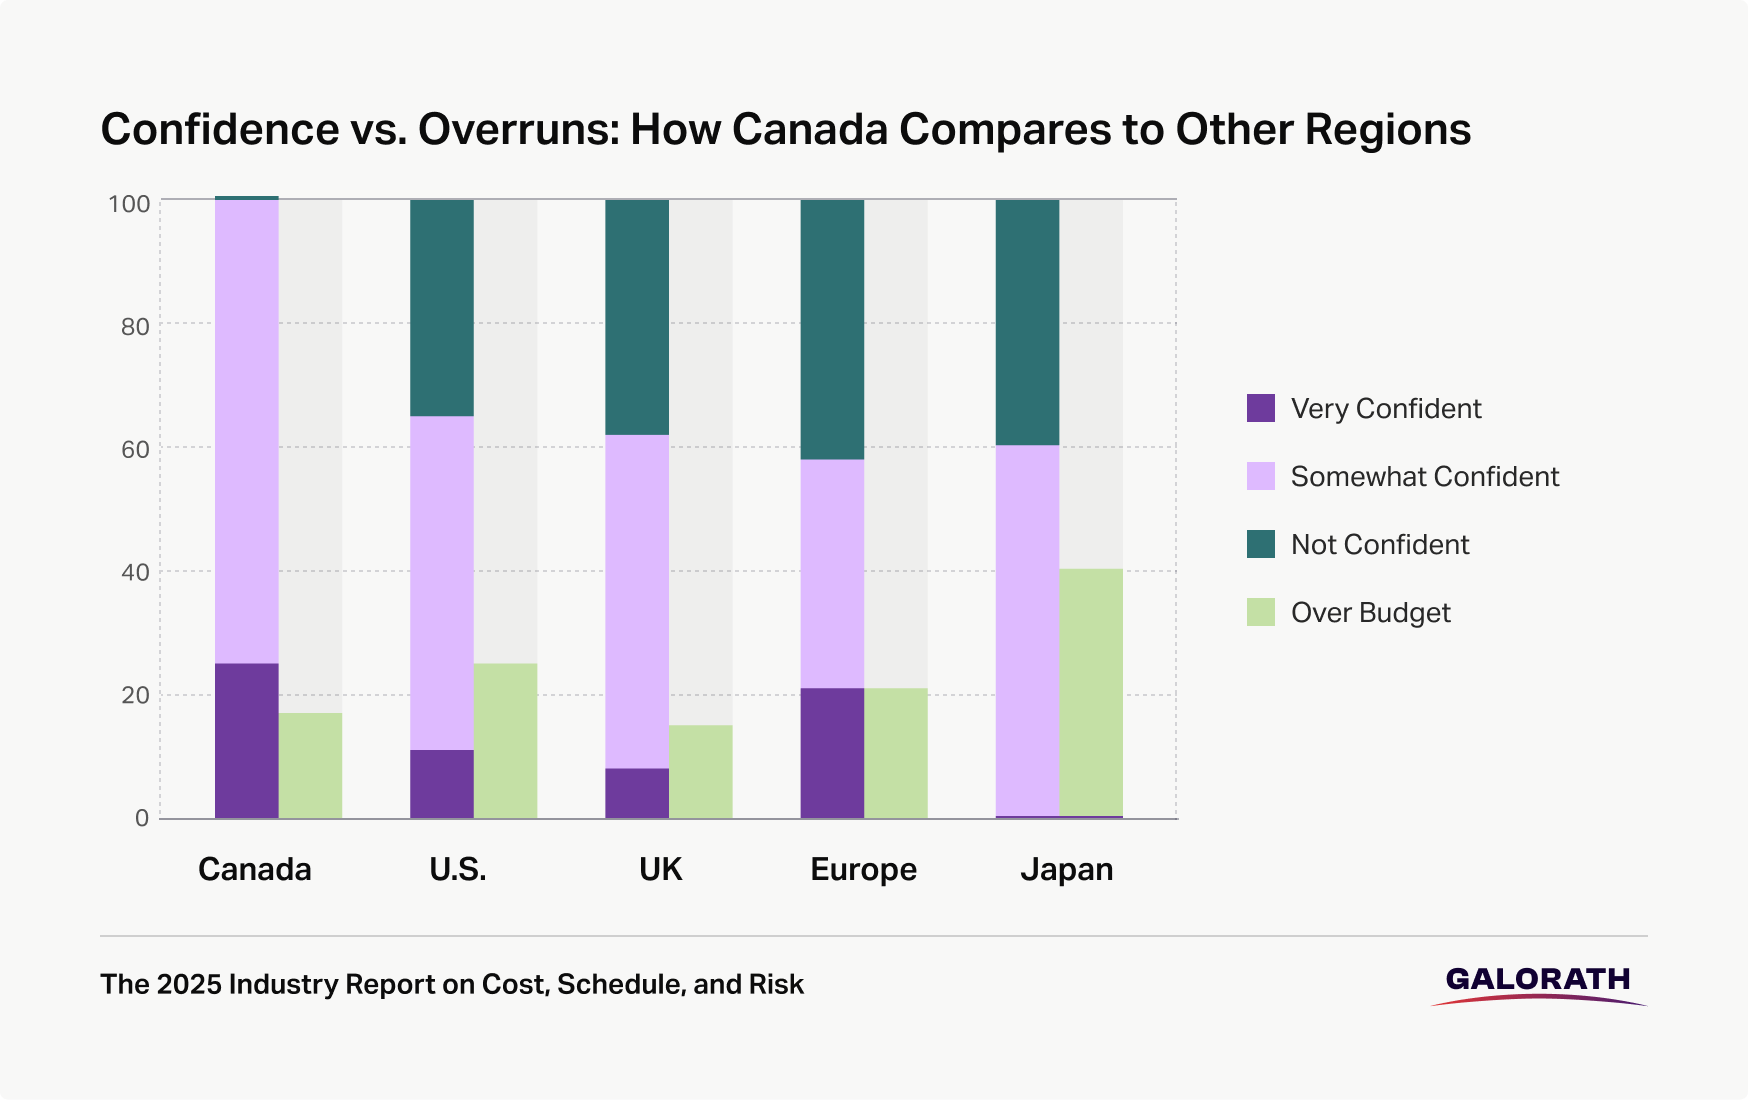
Confidence levels among Canadian estimation teams are among the highest of any region in Galorath’s 2025 survey. One in four respondents describe themselves as very confident in their current cost estimation process. The remaining 75% report being “somewhat confident”. Not a single Canadian respondent selected “not confident,” making Canada the only region in the dataset with zero responses in that category.
Confidence alone is not unusual. In several regions, teams express moderate belief in their estimation capabilities. What sets Canada apart is that this confidence is largely supported by measurable results.
Only 17% of Canadian respondents report that their projects frequently go over budget. This is one of the lowest overrun rates in the global dataset. The United States, by comparison, shows a 25% frequency of cost overruns, with only 11% of teams expressing very high confidence. In Japan, the picture is even more strained. Forty percent of respondents report frequent overruns, and none indicated high confidence.
Even Europe, which performs more moderately on budget metrics, reports higher overrun rates and lower overall confidence. Twenty-one percent of European respondents say they frequently exceed their budget estimates, and only 21% say they are very confident in their current approach. The United Kingdom is the only other region with a similarly low overrun rate, at 15%, but UK respondents report the lowest confidence levels in the survey. Just 8% say they are very confident, despite relatively strong budget adherence.
This contrast between perception and performance in other regions underscores the credibility of Canada’s results. Teams are not just confident. They are achieving results that support that confidence. This pattern suggests that estimation practices in Canada are generally well developed, with effective use of historical data, stakeholder inputs, and process controls to inform reliable cost predictions.
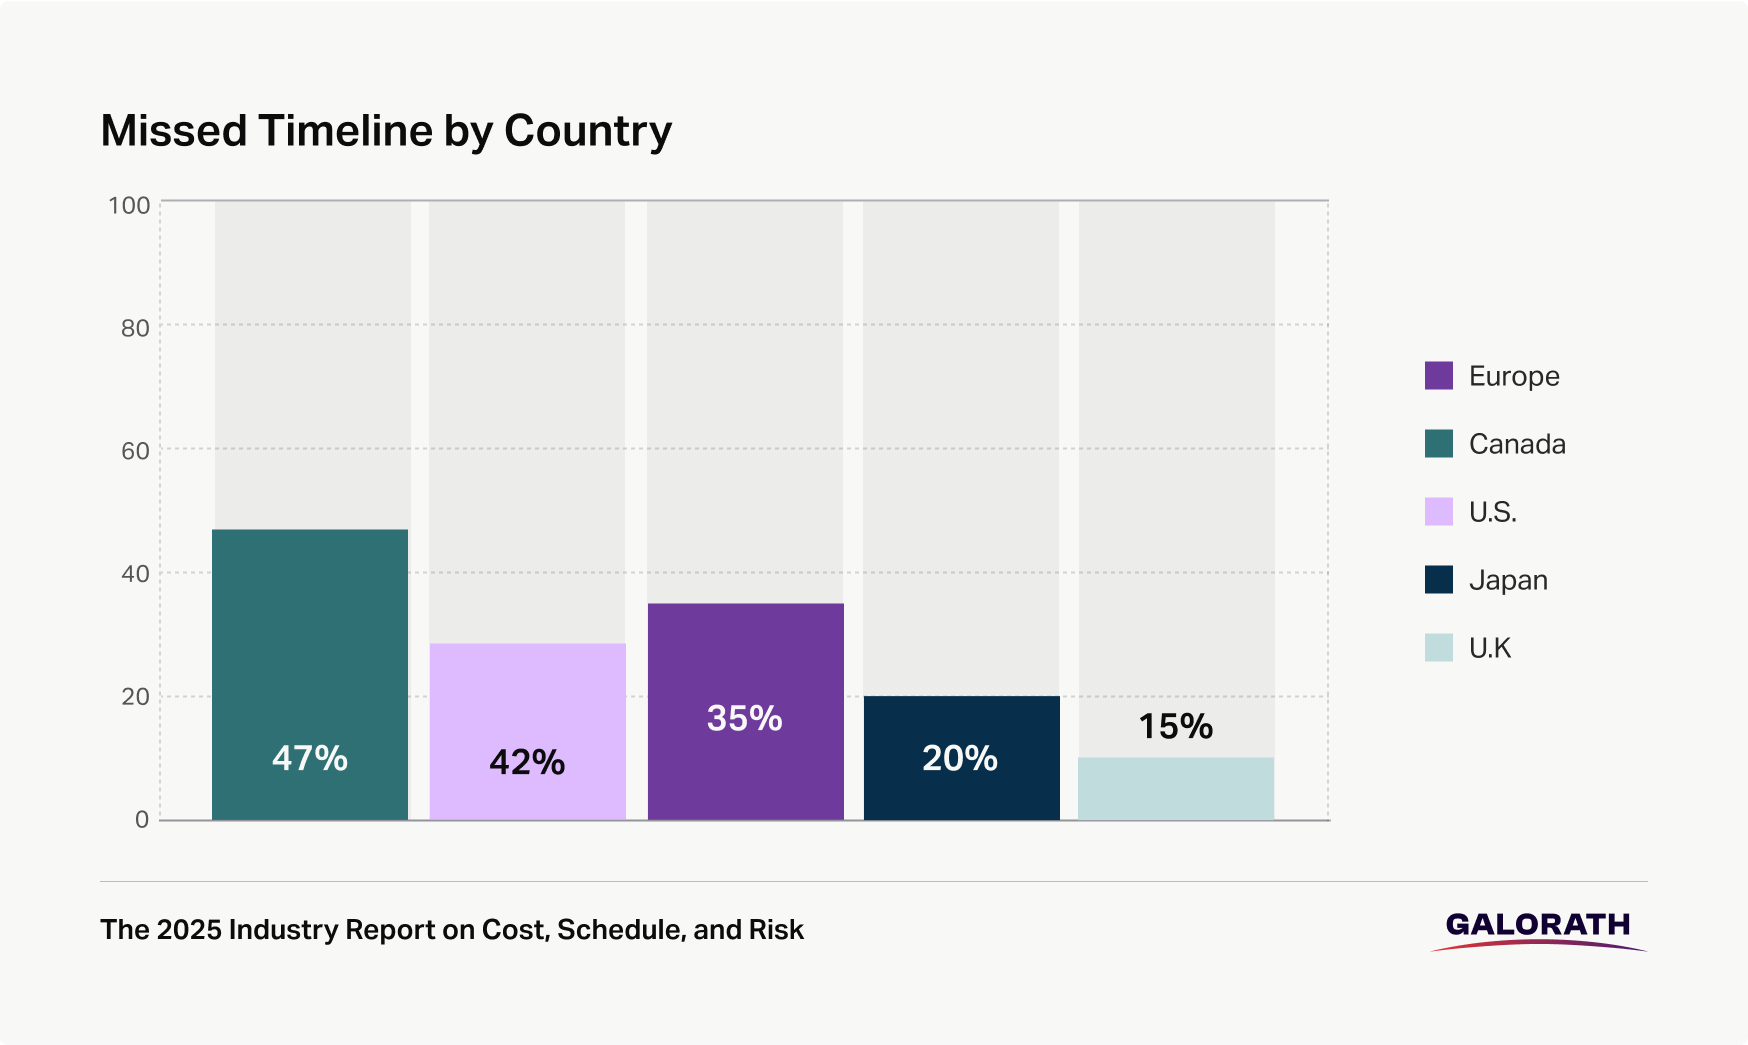
While Canadian estimation teams excel at forecasting project costs, their ability to meet timelines presents a significant challenge. Forty-two percent of Canadian respondents report that their projects frequently miss scheduled delivery dates. This is the second highest delay rate among all regions surveyed, exceeded only by Europe, where 47% of respondents report frequent schedule slippage.

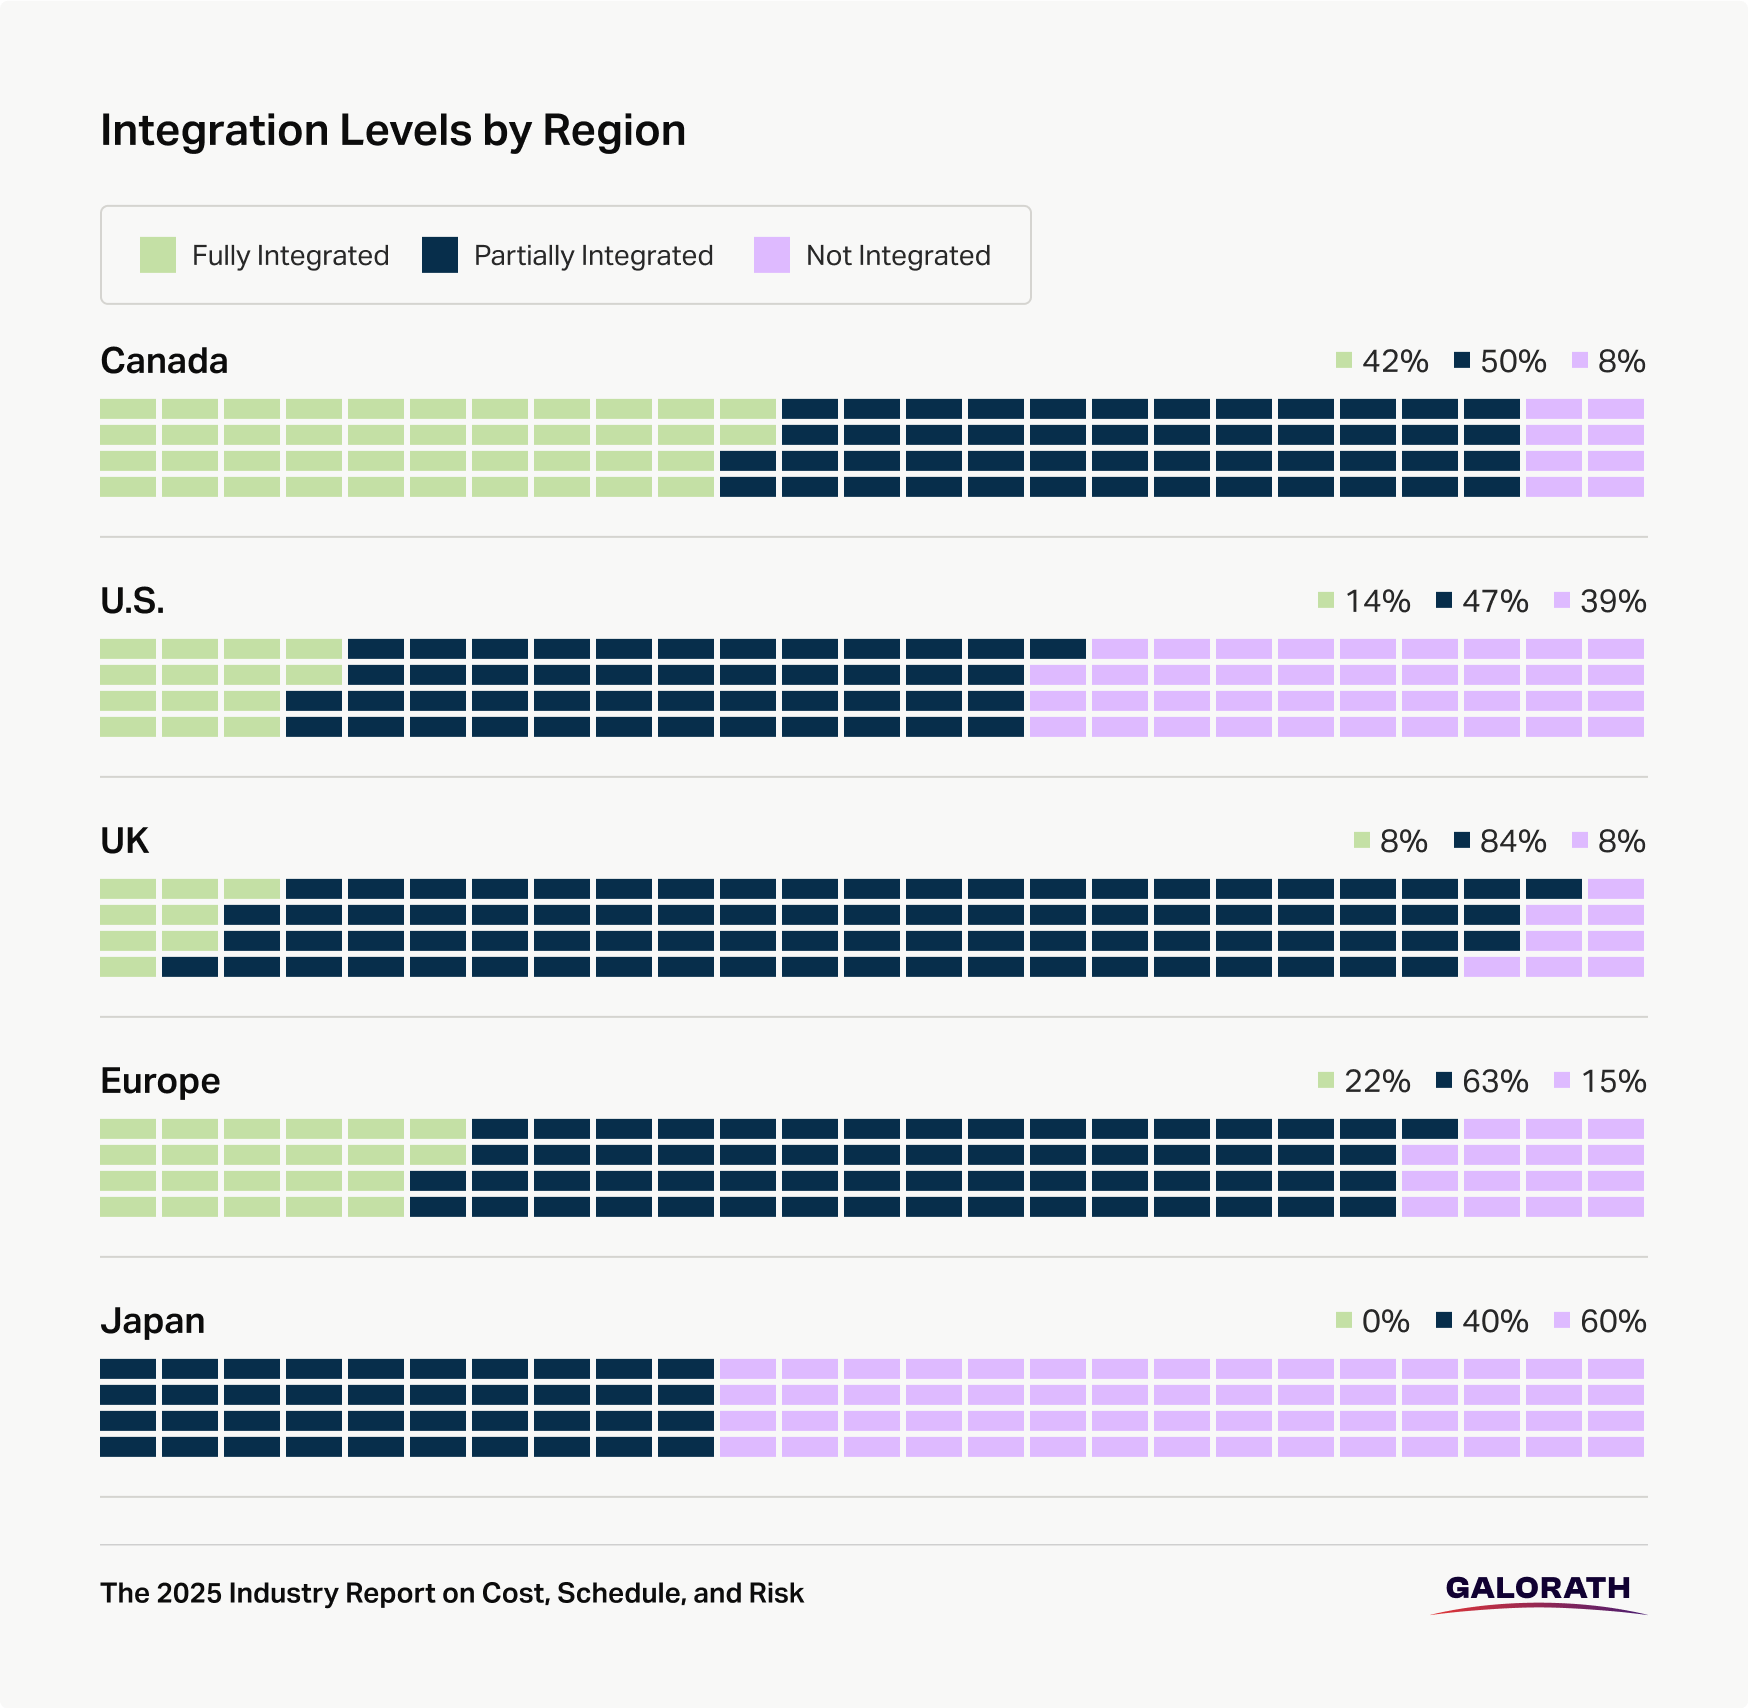
Canadian teams report the highest rate of full system integration across all regions surveyed, making them a leader in technical connectivity. Forty-two percent of respondents say their estimation systems are fully integrated across departments. An additional 50% report partial integration. Only one respondent indicated that their systems are not integrated at all.
This makes Canada the most connected region in the survey. By comparison, just 14% of U.S. teams report full integration, and 39% say their systems are not integrated at all. In Europe, 22% of respondents report full integration. In Japan and APAC, no respondents reported having fully integrated systems.
This high level of system integration in Canada should, in theory, allow for faster information flow, stronger collaboration between teams, and more accurate estimates that reflect current project conditions. In practice, however, these benefits are not yet fully realized. Despite leading in integration, Canadian teams still report the second-highest rate of schedule delays in the dataset. Forty-two percent say they frequently miss delivery timelines, indicating that integration alone is not sufficient to improve execution outcomes.
Several reasons may explain this gap. First, the type of integration matters. While systems may be connected, many teams still rely on static reporting or batch data transfers, rather than real-time updates. This limits the ability to respond quickly when plans shift. Second, many estimation systems are not fully linked with downstream project controls or scheduling platforms. As a result, even if initial estimates are accurate, changes during delivery may not be reflected promptly in project timelines.
Data reuse is strong, but its value depends on how insights are applied. Eighty-three percent of Canadian respondents say they use historical project data in their estimates. Seventy-five percent incorporate engineering estimates, which suggests a solid foundation of technical inputs. However, there is less evidence that these inputs are used to flag schedule risks or model project delays. In many cases, historical data may be used primarily for cost calibration, rather than for timeline forecasting.
Interviews conducted with selected respondents indicate that even well-integrated systems often lack shared workflows. Estimators, schedulers, and delivery teams may use the same tools but operate under different assumptions or goals. This limits the strategic value of integration. If outputs are not interpreted consistently or handed off with context, the benefits of connectivity are diluted.
Canada’s strong integration rates should be viewed as a strategic advantage, but also as a missed opportunity. With the right enhancements, integration can move beyond data sharing and support predictive risk management, automated alerts, and cross-functional decision making. Teams that invest in connecting their estimation environments with delivery workflows are more likely to reduce timeline misses and scale their estimation practices more effectively across programs.

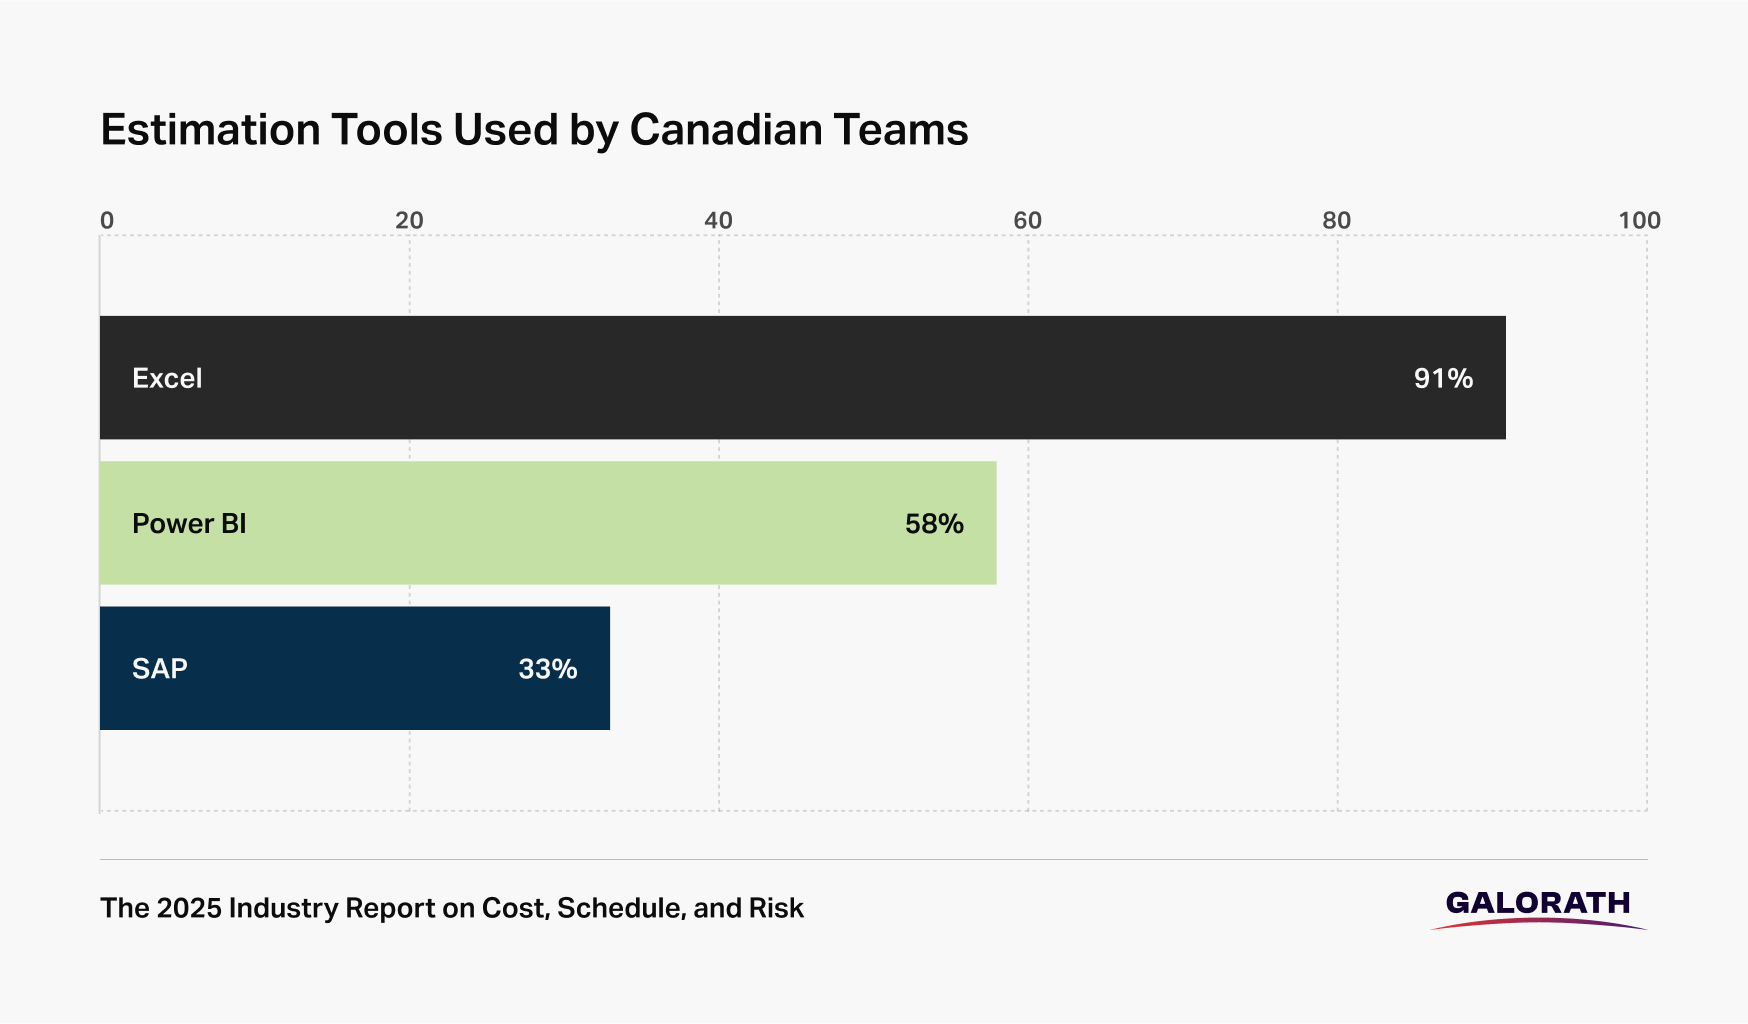
Ninety-one percent of Canadian teams use Excel in their estimation process. Power BI (58%) and SAP (33%) are also common. Project tracking tools such as ClickUp, Smartsheet, and Trello appear in open responses. Training does not appear to be a major barrier, with only 8% citing it as a concern.
The challenge is not tool access, but workflow consistency. Creating shared standards across platforms will support better handoffs and output alignment.
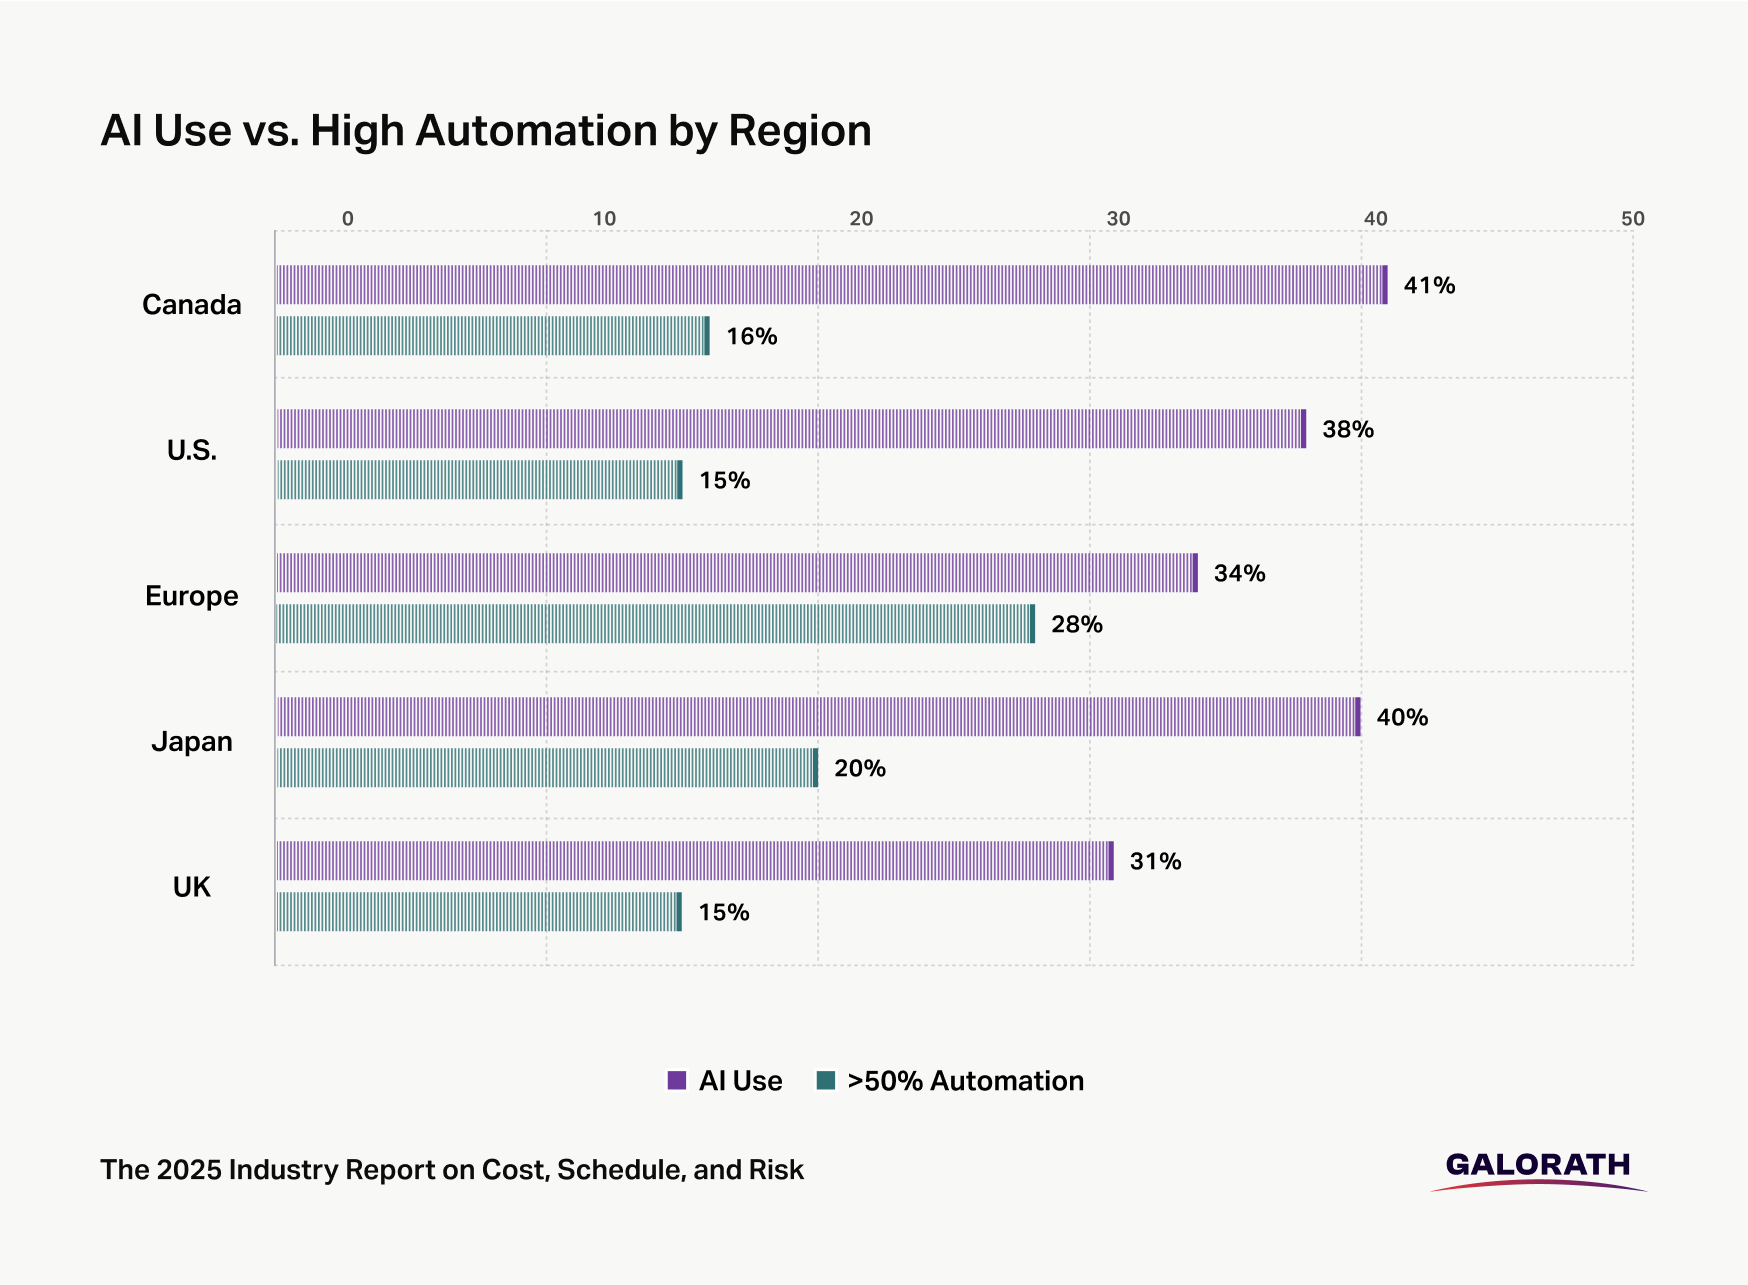
Canadian cost estimation teams are early adopters of artificial intelligence, but broad-scale automation remains limited. Forty-one percent of respondents say they are currently using AI tools as part of their estimation process. This puts Canada ahead of most other regions, including the United States at 38% and Europe at 34%. Only Japan is close, with 40% adoption. APAC respondents reported no AI usage.
Despite this encouraging uptake, AI has not yet led to widespread automation of estimation workflows. Only 16% of Canadian respondents say that more than half of their estimates are automated. The majority report that automation occurs only at specific task levels, such as data classification, formula application, or unit cost calculations. End-to-end automation that spans data ingestion, model selection, scenario building, and output formatting remains rare.
While Europe has a slightly higher rate of high automation, it lags behind Canada in AI adoption overall. This suggests that some regions may be further along in converting AI experimentation into structured, repeatable workflows. In Canada, the slower path to automation may reflect caution, resourcing gaps, or the complexity of integrating AI into highly regulated or engineering-intensive environments.
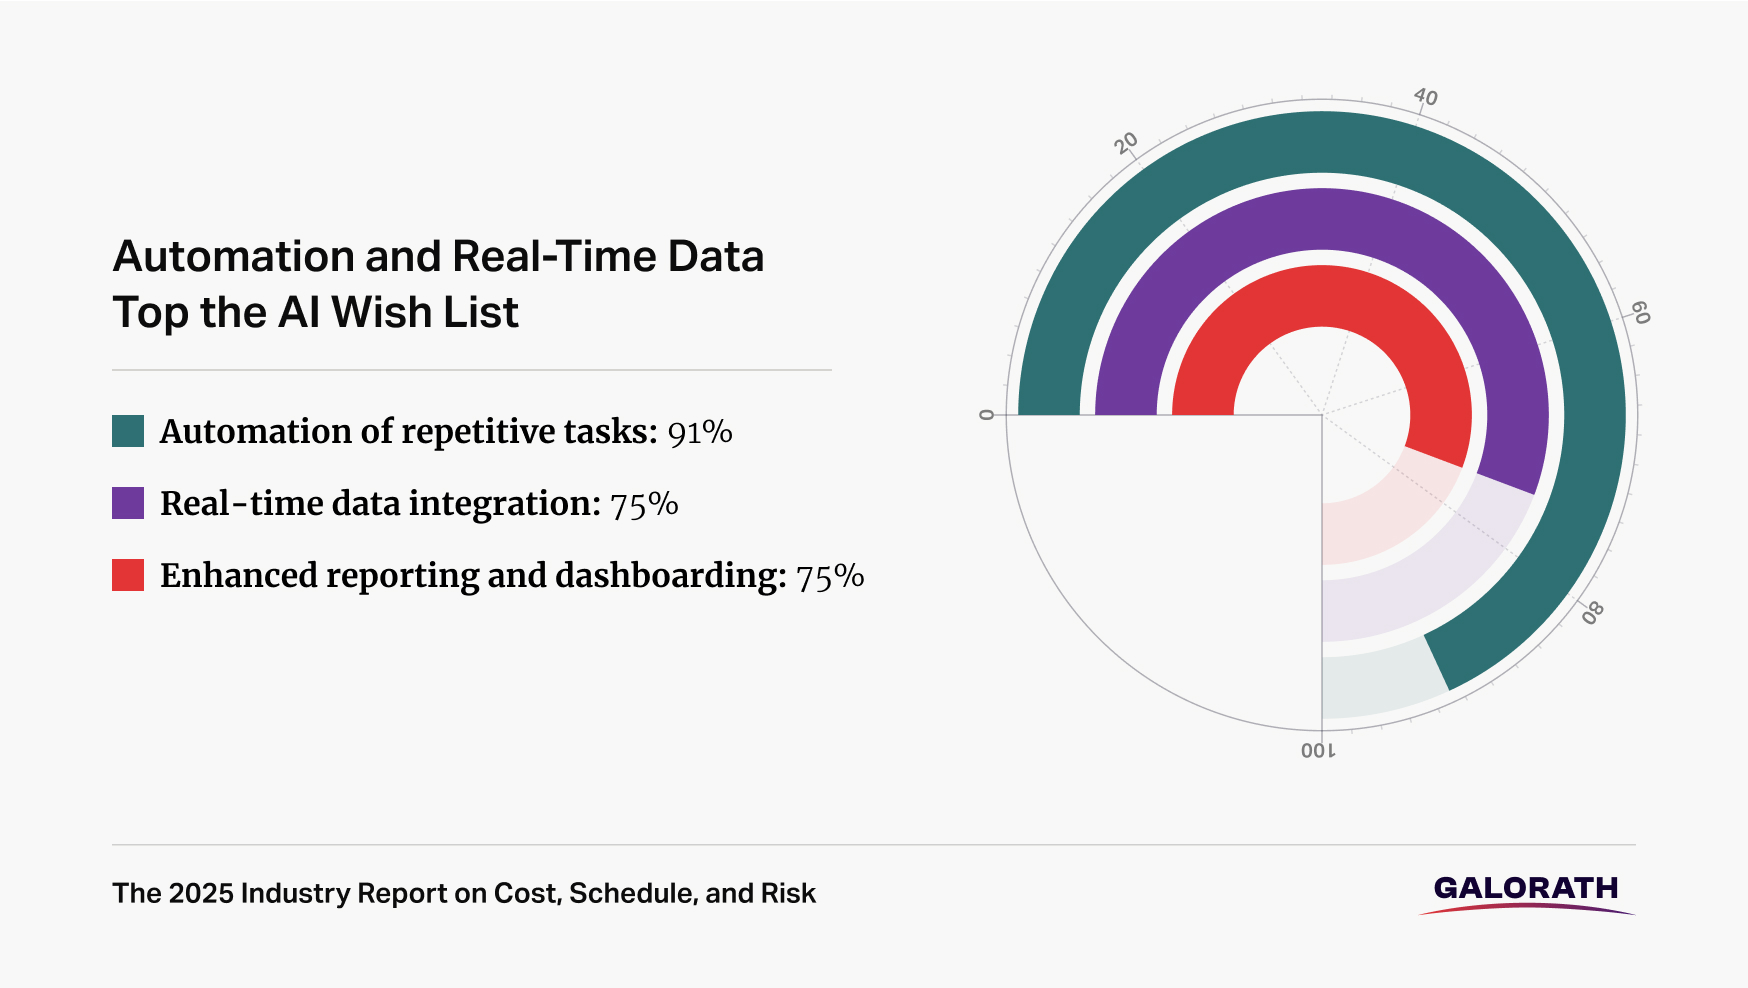
The survey also asked respondents which features would most improve their estimation processes. Ninety-one percent of Canadian teams identified automation of repetitive tasks as a top priority. Seventy-five percent also selected real-time data integration and improved reporting as key capabilities. These preferences reflect an appetite for smarter, more responsive systems that reduce manual workload and support faster decision-making.
Although these responses signal digital openness, they also highlight a gap between current capabilities and desired outcomes. Most organizations are still in the early stages of building AI maturity. Use cases remain narrow, and model performance is often evaluated manually rather than automatically validated across projects. Few teams report the use of AI for tasks such as uncertainty modeling, confidence scoring, or predictive variance analysis.
To move forward, Canadian teams will need to focus on three enablers: access to structured historical data, alignment between cost and delivery systems, and change management that supports AI adoption. Historical data is already widely used—83% of respondents say they incorporate it into their estimates—but data must be normalized and context-rich to support AI. Integration is also in place, as Canada leads in system connectivity, but teams must ensure that AI outputs are usable across delivery, finance, and governance functions. Finally, without executive sponsorship and training, even well-designed tools may fail to gain traction.
AI use in Canadian estimation is ahead of the curve, but it has not yet delivered its full promise. The next wave of value will come not just from using AI, but from using it to accelerate judgment, reduce rework, and close the gap between what is estimated and what is delivered.
Only 20% of Canadian respondents say ESG is extremely important in their estimation process. Just one-third report tracking alignment across departments as a success metric.
As ESG regulations evolve and project planning becomes more strategic, these considerations are likely to gain importance. Canadian teams may benefit from embedding ESG and alignment measures more deeply into their estimation frameworks, especially for public or export-driven projects.
0%
ESG “extremely important”
0%
tracks organizational alignment
Survey data reveals how priorities differ across functional roles
Program Leaders: Expand use of alignment metrics and implement formal review cycles.
Cost Estimators: Pilot schedule risk modeling and automation in early-phase.
Data and IT Leaders: Use integration capabilities to build dashboards and auto-alerts.
Executives: Connect estimation transparency to ESG reporting and strategic KPIs.
This report is part of a deeper look at how cost, schedule, and risk planning are evolving. Access the full 2025 Industry Report on Cost, Schedule, and Risk to see where the biggest gaps and opportunities exist.
Access The ReportAccess the infographic to keep the most important data points from the report on hand.
Download Infographic