Mastering Cost Risk with the CRED Model: A New Approach to Managing Uncertainty

New: SEERai by Galorath
With SEERai, teams move from raw data to estimates in hours instead of weeks. Every output is traceable, audit-ready, and designed to improve decisions across estimating, sourcing, and risk.
Introducing SEER by Galorath
SEER Overview →Galorath’s platform combines trusted cost logic with AI to deliver fast, structured estimates that drive better decisions from design through delivery.
AI use cases
See AI Use Cases →Essential use cases
See All Use Cases →Latest articles

Why Most ROI Models Miss the Real Value of Estimation

Table of Contents
A large number of projects fail because teams often make inaccurate estimates for time, cost, and effort. Most methods end up relying on a single guess, ignoring risk and uncertainty. This problem can easily be solved by three-point estimating because it uses a range of values instead of just one.
Project managers use three-point estimating method when they want more accurate forecasts. This estimation technique works well for time estimation, cost estimation, and effort estimation. It is often used in planning tools like the Program Evaluation Review Technique (PERT) and the Critical Path Method.
This guide explains how the method works and how it differs from single-point estimating. It covers the two main approaches it uses, triangular distribution and beta distribution (PERT), and shows how they relate to concepts like standard deviation. You’ll also learn how project teams use PERT charts to estimate timelines more accurately.
Three-point estimating gives you better control by showing what’s possible, what’s most likely, and what could go wrong-so your project stays on track.
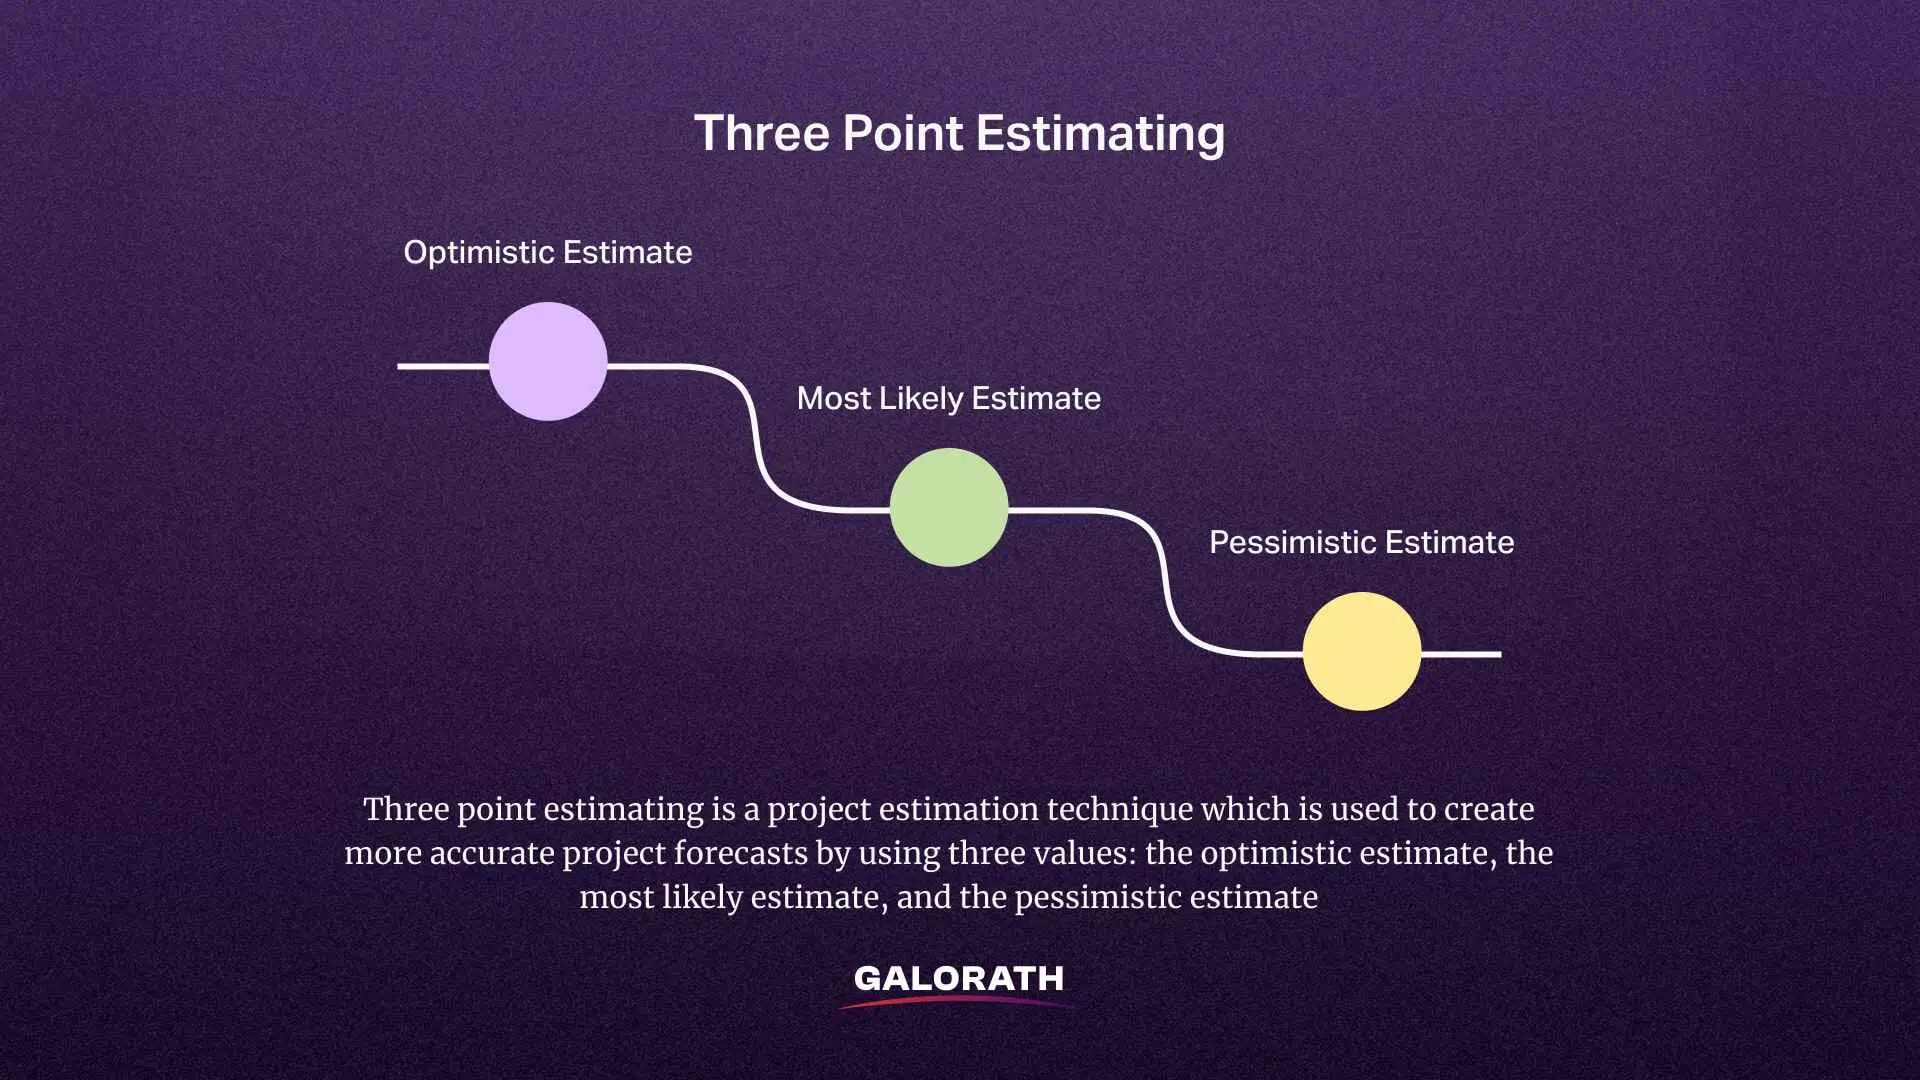
Three-point estimating is a project estimation technique used to create more accurate project forecasts by utilizing three values: the optimistic estimate, the most likely estimate, and the pessimistic estimate. Instead of guessing a single number, teams calculate an expected duration or cost that reflects uncertainty in the task or activity. This method improves estimation accuracy because it shows a range of potential outcomes.
Project managers often use it in project management when they plan for activity duration, time estimation, or cost estimation. It gives them a better chance to spot risks and plan resources wisely. This estimation method enhances both accuracy and objectivity in activity time estimation, especially when handling uncertainty.
Three-point estimating is one of the core estimation techniques used in project management to improve the accuracy of project forecasts. Teams use it when they want to reduce uncertainty and plan for a range of possible outcomes instead of relying on a single guess.
Compared to single-point estimating, this method offers a more flexible and realistic approach, especially when data is incomplete or when risk is high. Three-point estimates reduce the subjectivity and uncertainty regarding the anticipated start time of the proposed activity, helping improve both accuracy and objectivity in project scheduling.
Project managers apply three-point estimating in key areas of planning, including:
This method is especially useful during the early phases of a project, where exact values are hard to define. Unlike fixed-value methods that ignore uncertainty, three-point estimating techniques help teams make informed decisions by factoring in the optimistic, most likely, and pessimistic scenarios.
Project teams also use this method to support resource allocation, improve planning accuracy, and identify potential delays or risks in the project schedule. Incorporating three-point cost estimation into project planning models improves sustainability outcomes and enhances decision-making by accounting for variability.
Three-point estimating works by defining three input values for each task: an optimistic estimate, a most likely estimate, and a pessimistic estimate. Teams use these values to calculate the expected duration or cost of a task, rather than relying on a single estimate. This approach helps reduce uncertainty and improves estimation accuracy.
Here’s how each estimate type is defined:
After defining these three values, teams use them in one of two statistical models to calculate an expected outcome. Triangular and beta distributions (PERT) are commonly used for task time estimations in project management, with the triangular distribution treating all estimates equally. In contrast, the beta distribution (PERT) puts more weight on the most likely estimate to better reflect the typical project scenario.
Both models assume a normal distribution of outcomes, where the most likely result is the central point. However, they tend to produce different results. PERT beta distribution usually smooths out extreme values better, making it more suitable for complex projects.
The triangular distribution, on the other hand, is simpler and useful when teams have limited data. The choice between triangular and beta distributions can significantly affect the results of project estimations, with PERT often yielding more robust predictions in complex scenarios.”
Triangular distribution is a simple statistical model used in three-point estimating to calculate an expected duration or cost when you have limited data. It assumes that the best estimate lies somewhere between an optimistic, most likely, and pessimistic value, with all three estimates treated equally.
Triangular distributions are generally preferred as task time probability distributions, due to their simplicity and ease of use in the absence of detailed historical data.
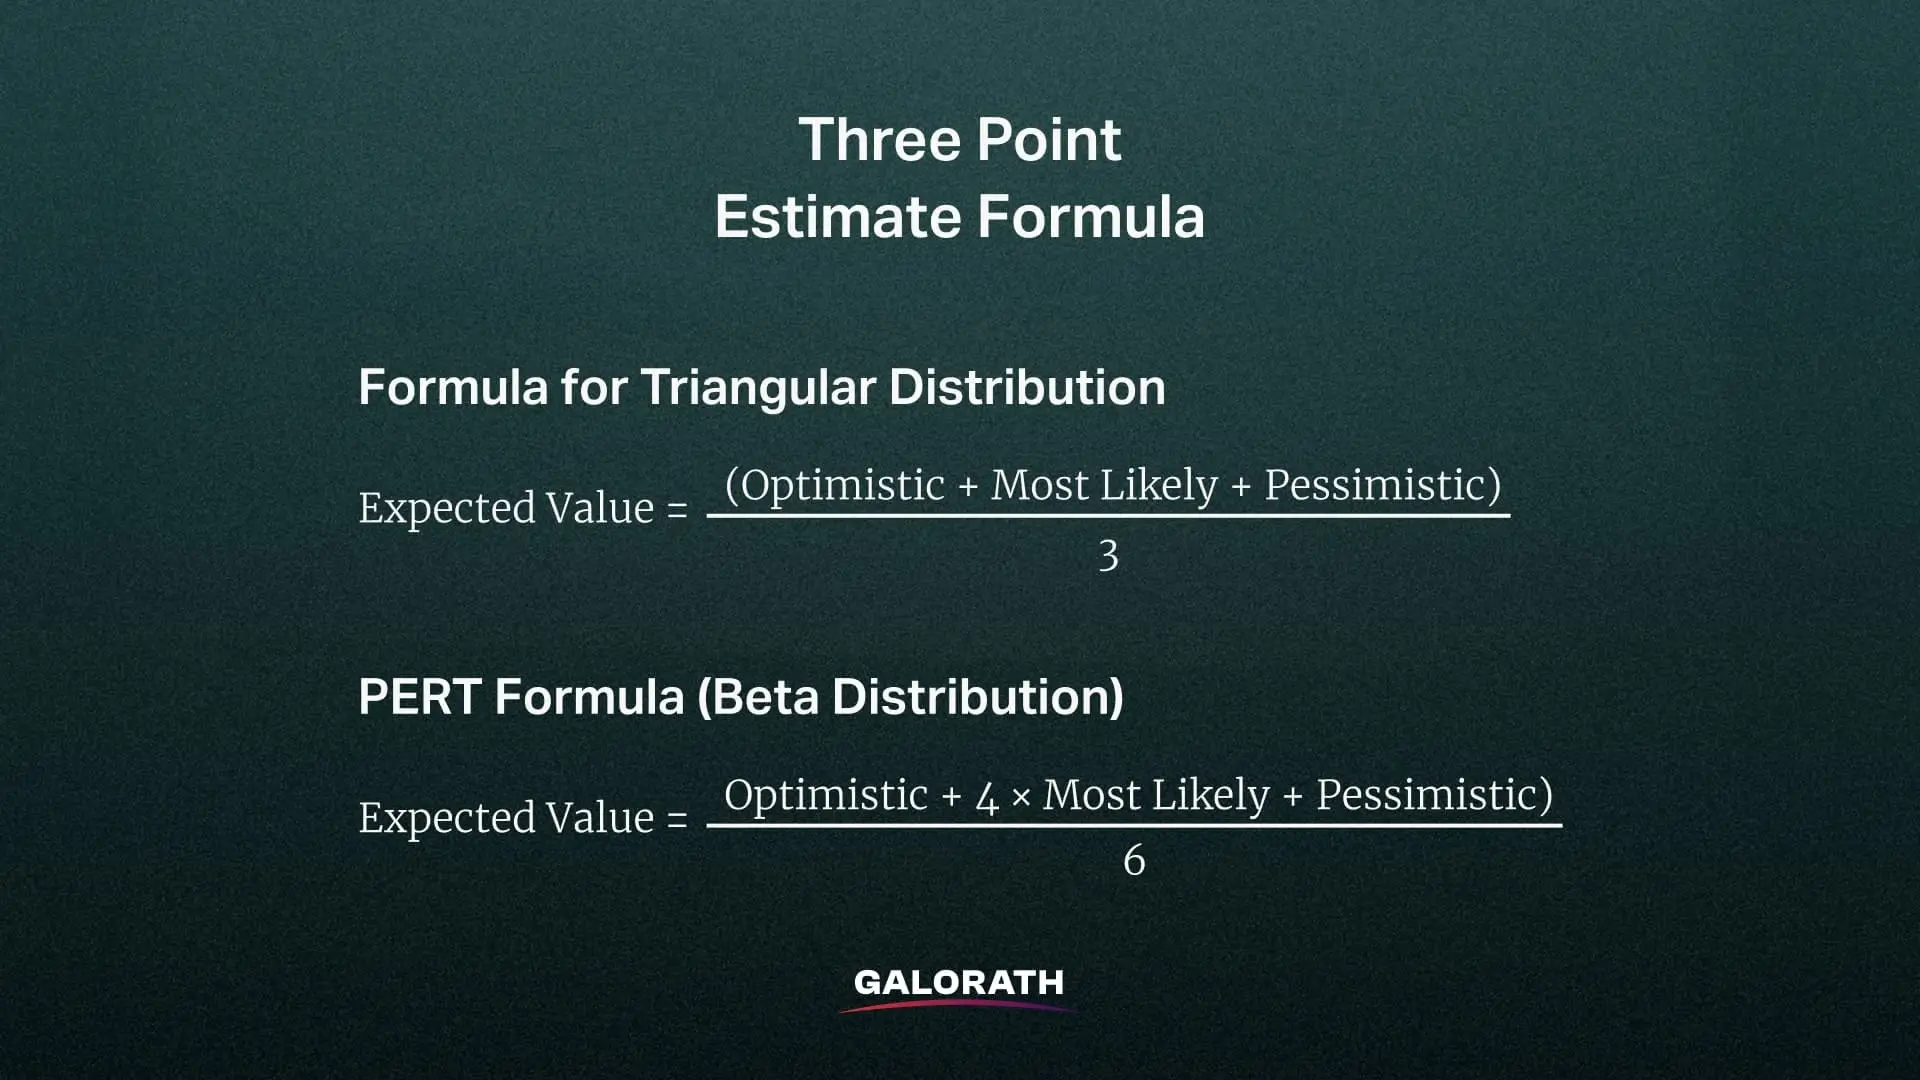
To calculate the expected value using this model, the following formula is applied:
Expected Value = (Optimistic + Most Likely + Pessimistic) / 3
This formula gives a basic average of the three inputs, without placing more weight on any specific estimate.
Triangular distribution is used when:
Project managers often apply triangular distribution during early planning stages or in smaller projects where time and resource constraints prevent deeper statistical analysis. Although it’s not as accurate as the PERT beta distribution, it still improves estimation accuracy over single-point guessing and helps teams visualize a realistic outcome range.
According to Aliyu Am, “Triangular distribution is often a useful tool when data is limited and a quick estimate is necessary.” Still, it may not be as effective for more complex projects that require more sophisticated models like PERT.
Beta distribution (PERT) is a weighted statistical model used in three-point estimating to calculate the expected duration or cost of a project task. It improves estimation accuracy by placing more emphasis on the most likely estimate, making it more realistic than the triangular distribution when data is uncertain or variable.
As Nickos Papadatos highlights, “The beta distribution (PERT) is effective in cases where task duration estimates are uncertain, as it allows for more weight to be placed on the most likely estimate”.
To calculate the expected value using PERT, use this formula:
Expected Value = (Optimistic + 4 × Most Likely + Pessimistic) / 6
This formula increases the weight of the most likely estimate, reducing the influence of extreme values (optimistic and pessimistic) and providing a more balanced forecast. According to Maciej Wolny, “The beta distribution (PERT) places significant emphasis on the most likely estimate, which helps provide more realistic forecasts for project durations”.
While both PERT and the generic beta distribution use probability curves, PERT simplifies the beta model by assuming a fixed shape and using only three parameters: optimistic, most likely, and pessimistic.
Traditional beta distribution, in contrast, requires shape parameters (α and β), making it more complex and flexible but harder to apply in practical project settings. As Budi Eko Prasetyo notes, “PERT simplifies the beta distribution by using three time estimates and is more commonly used in project management due to its practical applicability”.
PERT makes the beta model easier to use by:
The simplicity and adaptability of PERT make it a preferred method for project managers who need a quick and effective way to estimate task durations and costs, as explained by Nova Nevila Rodhi.
Project managers use the PERT beta distribution most frequently in:
Because of its ability to reduce the impact of extreme estimates, PERT helps teams create more reliable forecasts and improve overall planning accuracy.
Standard deviation measures how much variation or uncertainty exists in a set of values. In three-point estimating, it shows how far the actual outcome may spread from the expected duration or cost. A smaller standard deviation means your estimate is more consistent and reliable.
A larger one indicates higher risk or uncertainty. Standard deviation plays a crucial role in risk analysis and project management as it provides a clearer picture of potential fluctuations in project estimates.
In the context of PERT beta distribution, the standard deviation is calculated using this formula:
Standard Deviation = (Pessimistic – Optimistic) / 6
This formula uses the pessimistic and optimistic estimates to measure the range of uncertainty. It assumes that most outcomes fall within this range and follow a normal distribution. The standard deviation calculated using PERT is vital in understanding the spread of potential outcomes and is crucial for effective project planning.
Standard deviation plays a key role in risk analysis and planning accuracy:
Project managers use standard deviation to:
Including standard deviation in your estimates helps teams manage expectations and prepare for potential delays or cost overruns. According to Parlindungan Manik, “Integrating standard deviation into project management estimations helps project teams quantify uncertainty, enhancing decision-making and risk management”.
Three-point estimating can use different distribution models depending on the level of accuracy and risk tolerance. The three most common are the normal distribution, triangular distribution, and PERT beta distribution. Each model uses the same input values-optimistic, most likely, and pessimistic-but produces different results based on how it treats those values.
Let’s compare the results using the following input estimates for a task:
| Model | Formula | Result (in days) | Weight on Most Likely | Risk Handling |
| Triangular Distribution | (O + M + P) / 3 | 66 | Equal weight | Basic estimate |
| PERT (Beta Distribution) | (O + 4M + P) / 6 | 63 | Heavily weighted | Better smoothing |
| Normal Distribution | Based on historical mean + std. Dev. | 60 (assumed) | Assumes symmetry | Statistical projection |
Project managers choose the model based on how much data they have, how risky the task is, and how precise the estimate needs to be.
A PERT chart is a visual project management tool that maps out the sequence of tasks, their estimated durations, and their dependencies. It stands for Program Evaluation Review Technique, and it helps teams schedule, organize, and coordinate complex projects.
The PERT chart is a key tool for project managers to visualize the task dependencies and durations, which allows for better project planning and resource allocation.
Project managers use PERT charts to identify the critical path-the longest sequence of dependent tasks that determines the minimum time needed to complete a project. This allows them to plan efficiently, allocate resources, and detect possible delays before they happen.
Identifying the critical path in a PERT chart is essential for project success as it helps project managers focus on the most crucial tasks to ensure timely project completion.
To build a PERT chart, follow these steps:
Three-Point Estimating vs. Single-Point Estimating
Single-point estimating uses just one value to estimate the duration, cost, or effort for a task. This value usually comes from expert judgment or historical data and assumes that the estimate will occur exactly as predicted-without variation.
While this method is simple and fast, it doesn’t account for uncertainty, making it less reliable in complex or high-risk projects.
Teams then calculate an expected duration using either a triangular distribution or a PERT beta distribution, which helps reduce estimation errors by factoring in risk and variability.
| Feature | Single Point Estimating | Three-Point Estimating |
| Input | One value | Three values: O, M, P |
| Risk Handling | Ignores uncertainty | Accounts for uncertainty and variation |
| Accuracy | Lower | Higher due to weighted average |
| Use Case | Simple, low-risk tasks | Complex or high-risk tasks |
| Distribution Model | None | Triangular or PERT beta distribution |
| Planning Accuracy | Limited | Improved |
| Effort/Cost/Time Estimation | Basic | More realistic |
Three-point estimating offers several advantages over traditional estimation methods by improving accuracy, reducing risk, and enhancing decision-making. By incorporating optimistic, most likely, and pessimistic estimates, this method gives project managers a more complete picture of what could happen-rather than relying on a single assumption.
Using a range of estimates instead of one fixed value helps teams produce more accurate project forecasts. The triangular distribution and PERT beta distribution provide structured ways to calculate the expected duration, factoring in possible delays or accelerations. This improves cost, time, and effort estimation for projects. By doing so, teams can set more realistic expectations with stakeholders.
Three-point estimating accounts for uncertainty risk by modeling best-case and worst-case scenarios. This approach helps identify potential delays early in the planning process and prepares teams to adjust more effectively when problems arise.
It also supports:
While three-point estimating offers greater accuracy and flexibility, it also comes with challenges that project teams must manage. These challenges can affect the quality of the estimates and the efficiency of the planning process if not addressed properly.
One of the biggest challenges is collecting accurate optimistic, most likely, and pessimistic estimates. Team members may struggle to provide realistic inputs due to:
Unreliable inputs can distort the expected duration and weaken estimation accuracy.
Compared to single-point estimating, three-point estimating requires more time and effort. Teams must:
For large or fast-moving projects, this added complexity may delay planning or increase the risk of inconsistencies.
Organizations and project teams use three-point estimating to improve planning, control risk, and make better decisions across various areas of project management. This method is widely applied in industries like engineering, construction, IT, and product development, especially where time, cost, and scope are difficult to predict with certainty.
In practice, teams use three-point estimating techniques during early project planning or during risk assessment phases. They often follow this process:
This process helps companies improve planning estimation accuracy, support resource allocation, and identify potential delays before they impact the project.
Let’s look at how a software development team used three-point estimating to plan a key feature in a mobile app project. The task: developing a user authentication module that includes login, registration, password recovery, and integration with social login APIs.
The team broke the module into smaller tasks:
For the “OAuth setup” task, the team used historical data and developer experience to estimate:
Since this task involved moderate complexity and external dependencies, the team used the PERT beta distribution formula to calculate the expected duration:
Expected duration = (O + 4M + P) / 6
= (2 + 4×4 + 7) / 6
= (2 + 16 + 7) / 6 = 25 / 6 = 4.17 days
The team used this estimate in their sprint planning and flagged the task for potential delays. They also used standard deviation = (P–O) / 6 = (7 – 2) / 6 = 0.83 days to assess the task’s risk.
Three-point estimating directly supports risk management by modeling uncertainty and accounting for possible variations in project outcomes. Instead of assuming a single fixed value, this method uses optimistic, most likely, and pessimistic estimates to reflect a full range of potential scenarios for each task or activity.
By incorporating multiple estimates, three-point estimating enables project managers to more effectively handle uncertainty and account for the potential risks that might arise during project execution.
This method is particularly valuable in high-risk projects where the uncertainty of outcomes can significantly impact timelines and costs.
In three-point estimating, the use of optimistic, most likely, and pessimistic values allows project managers to anticipate a range of potential results, thereby improving the overall accuracy and reliability of project forecasts.
By incorporating the best- and worst-case scenarios, three-point estimating helps teams identify potential delays, cost overruns, or effort spikes early in the planning phase. This makes risks measurable rather than subjective.
The method provides a calculated standard deviation for each estimate, which helps teams determine how much buffer or reserve time and cost to add. This supports smarter resource allocation and more accurate risk responses.
When used with models like the PERT beta distribution, three-point estimating improves estimation accuracy by reducing the influence of extreme values while still considering them. This leads to more realistic timelines and budgets.
Project managers use outputs from three-point estimates in:
Three-point estimating is better than single-point estimating because it improves estimation accuracy by including optimistic, most likely, and pessimistic estimates. It handles uncertainty risk better than single-point estimating, which uses only one value.
Triangular distribution gives equal weight to all estimates, while PERT beta distribution emphasizes the most likely estimate, resulting in a smoother and more accurate expected duration.
It improves planning accuracy, helps with resource allocation, and flags potential delays by giving a more realistic view of activity duration and cost.
PERT beta distribution should be used for complex projects with high risk, while triangular distribution should be used when data is limited and fast estimates are needed.